Dashboard Overview and Composition
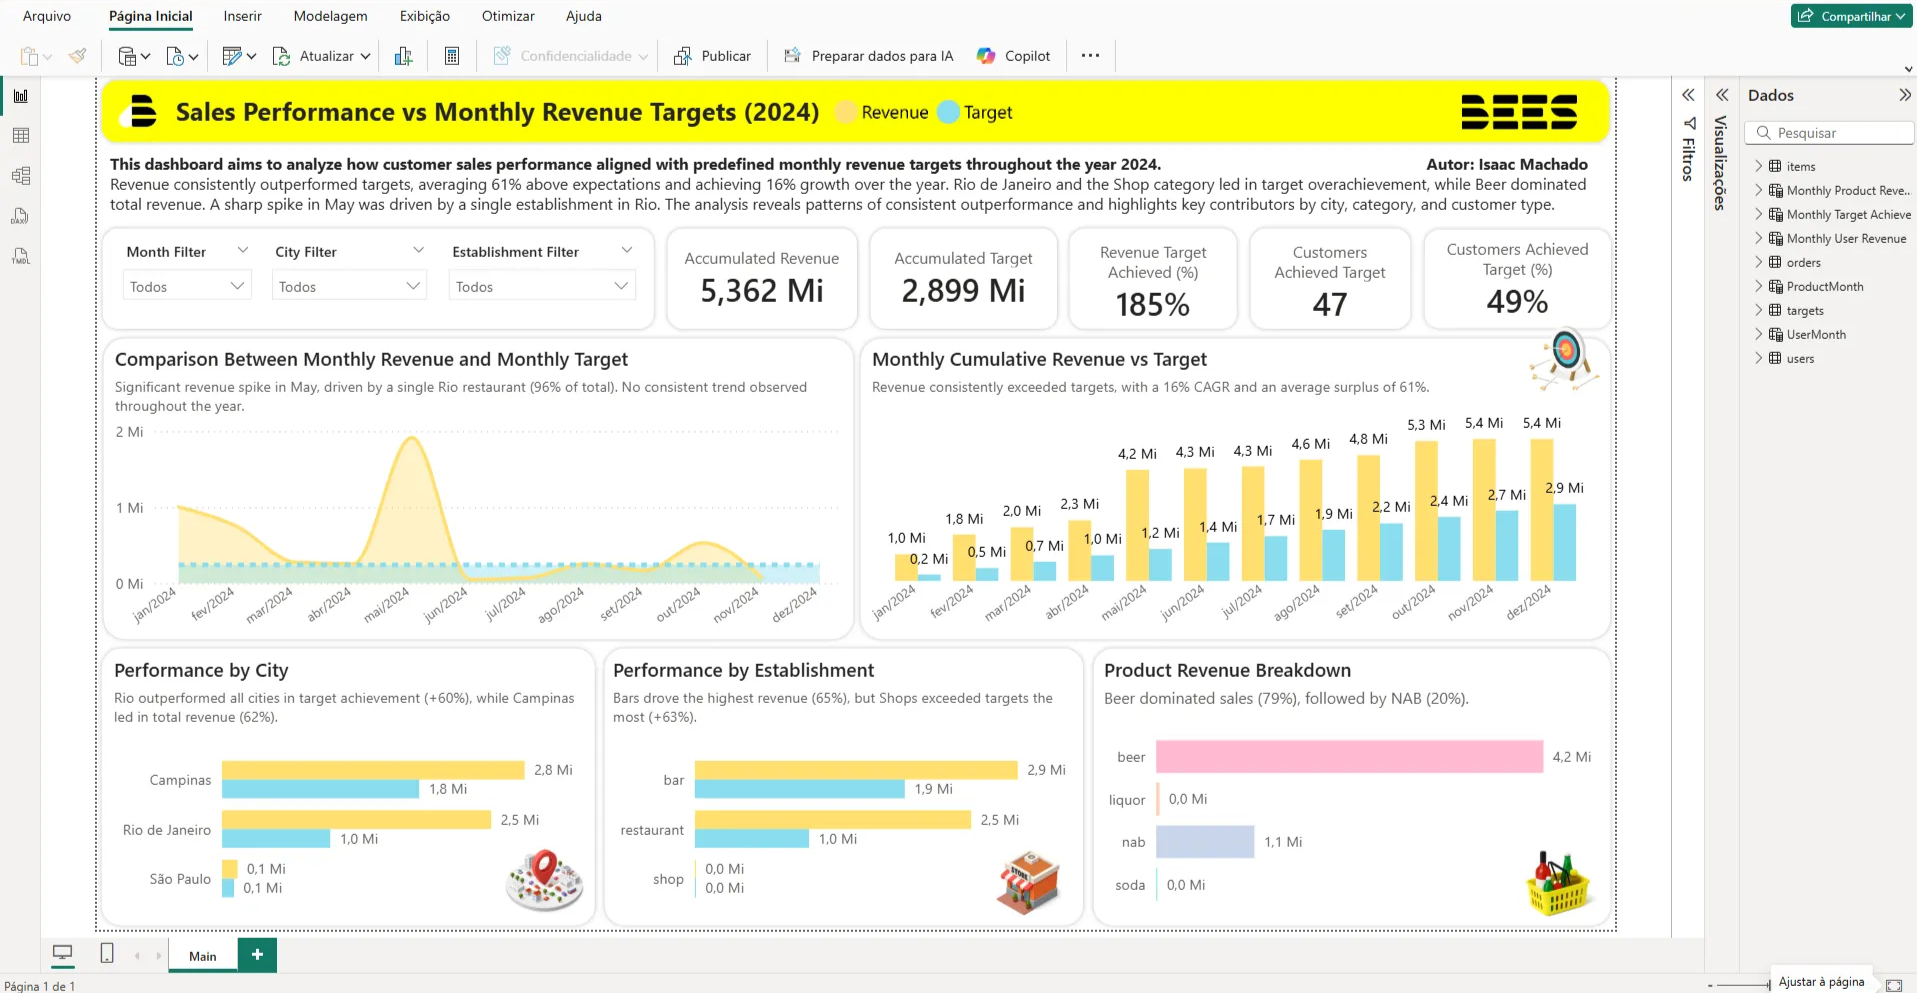
Main dashboard showing overall sales performance metrics
Data Architecture and Modeling
The construction of this dashboard started from an originally fragmented base consisting of four tables — orders, users, items, and targets. To enable robust customer-level analysis, including periods without sales, it was necessary to create auxiliary tables, allowing monthly revenue summarization and establishing reliable relationships between the data.
This structural work was essential to ensure consistency in the analyses and generate relevant insights throughout the year.
Orders
Transaction records with order details and timestamps
Users
Customer information and segmentation data
Items
Product catalog with categories and attributes
Targets
Monthly revenue goals per customer segment
This analysis is based on three comprehensive tables that describe items sold in stores, users who made purchases in those stores, company-defined targets for users to achieve, and a central table containing all orders placed by customer clients.
With this dataset in hand, the primary focus emerges: analyzing how customer sales performance aligned with predefined monthly revenue targets throughout 2024.
The dashboard features three interactive filters allowing users to select specific months, cities, and establishment types. Additionally, four key cards display:
- Cumulative revenue achieved in the dataset
- Respective cumulative target
- Percentage of global target achieved
- Number of customers who met their individual targets
- Percentage of customers who exceeded their targets
This structure reveals that some customers significantly exceeded their defined targets, compensating for those who fell short in the global target calculation.
Key Performance Indicators
The analysis replicates through time series in the charts below, representing monthly revenue volume and accumulated revenue over the months, always in comparison with targets. The three lower charts show the relationship between targets and revenue grouped by city, establishment type, and product category.
Financial and Operational Analysis
In 2024, sales not only exceeded monthly revenue targets but also revealed significant growth potential in specific cities and categories — offering clear directions for both expansion and strategic maintenance.
The results were impressive: average monthly revenue exceeded the target by 61%, with a compound growth rate of 16% per month. Although the target remained constant, we observed monthly revenue fluctuations, with a peak in May driven by a restaurant in Rio de Janeiro, responsible for 96% of that month's revenue.
This atypical concentration — divided almost equally between beer and non-alcoholic beverages — warrants investigation, as it may signal a promotional action or high-impact campaign with replication potential.
Performance by City
Rio de Janeiro
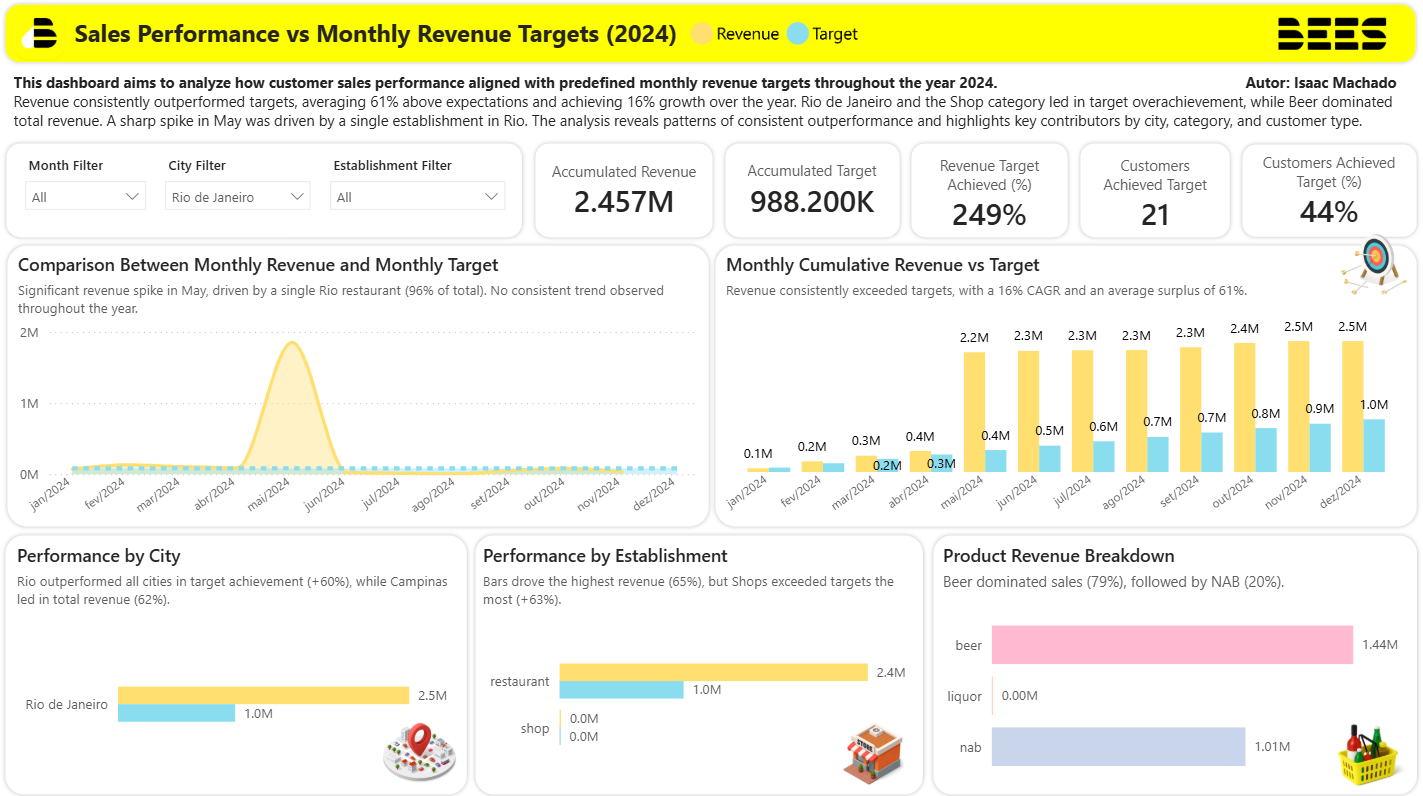
Rio de Janeiro sales performance breakdown
Rio de Janeiro stood out in relative performance against targets, exceeding them by 150%. The Shop category contributed significantly, with 58% of customers in this category meeting or exceeding their targets.
Additionally, non-alcoholic beverages represented 25% of sales in Shops and 41% in restaurants, pointing to a concrete opportunity for expansion in this segment.
Campinas

Campinas sales performance analysis
Among the cities analyzed, Campinas led in absolute revenue volume, accounting for 62% of sales, with a strong presence in the bar category and focus on beer.
The strongest performance in the early months of the year suggests possible seasonality, which deserves deeper analysis for strategic planning.
São Paulo
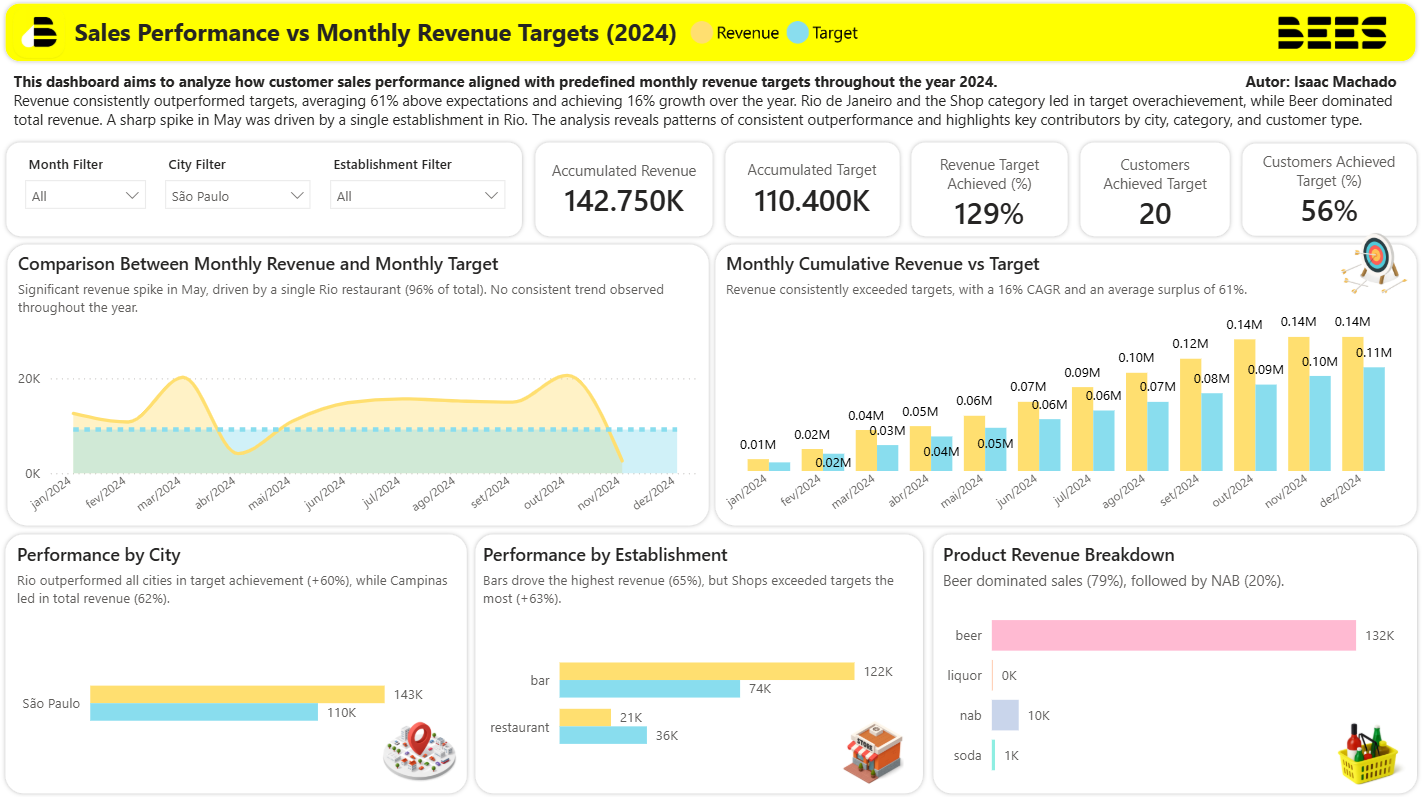
São Paulo market performance metrics
São Paulo presented a consolidated and mature profile, with 75% of customers in the bar category exceeding their targets by 65%. Beer represented more than 90% of revenue, indicating a clear and loyal consumption pattern.
Strategic Conclusions
In summary, the data not only confirms consistent target achievement but also reveals concrete growth opportunities in specific products and regions. This insight guides both promotional actions and reinforcement of consolidated markets — a strategic balance between growth and sustainability.
This vision provides a roadmap for scaling operations while maintaining strong performance in established markets, ensuring sustainable growth aligned with customer needs and market dynamics.
Key Takeaways
- Average monthly revenue consistently exceeded targets by 61% throughout 2024
- Compound monthly growth rate of 16% demonstrates strong market momentum
- Non-alcoholic beverage segment shows significant expansion potential, especially in Rio de Janeiro
- Campinas leads in absolute volume, while Rio excels in relative performance
- São Paulo represents a mature, stable market with loyal beer consumption patterns
- Opportunity to replicate high-impact promotional strategies identified in May performance spike