Project Overview
Challenge: Analyze a complex relational database of a Brazilian e-commerce marketplace to uncover actionable insights on logistics performance, revenue optimization, payment behavior, customer satisfaction, and retention strategies.
Brazilian E-Commerce Public Dataset by Olist
This project demonstrates advanced SQL proficiency through five strategic analyses of the Olist marketplace dataset, containing 9 interconnected tables with customer orders, products, sellers, payments, reviews, and geolocation data.
The analysis leverages MySQL 8.0+ features including Common Table Expressions (CTEs), window functions (RANK, DENSE_RANK, PERCENT_RANK, NTILE, LAG), and complex multi-table joins to extract business-critical insights.
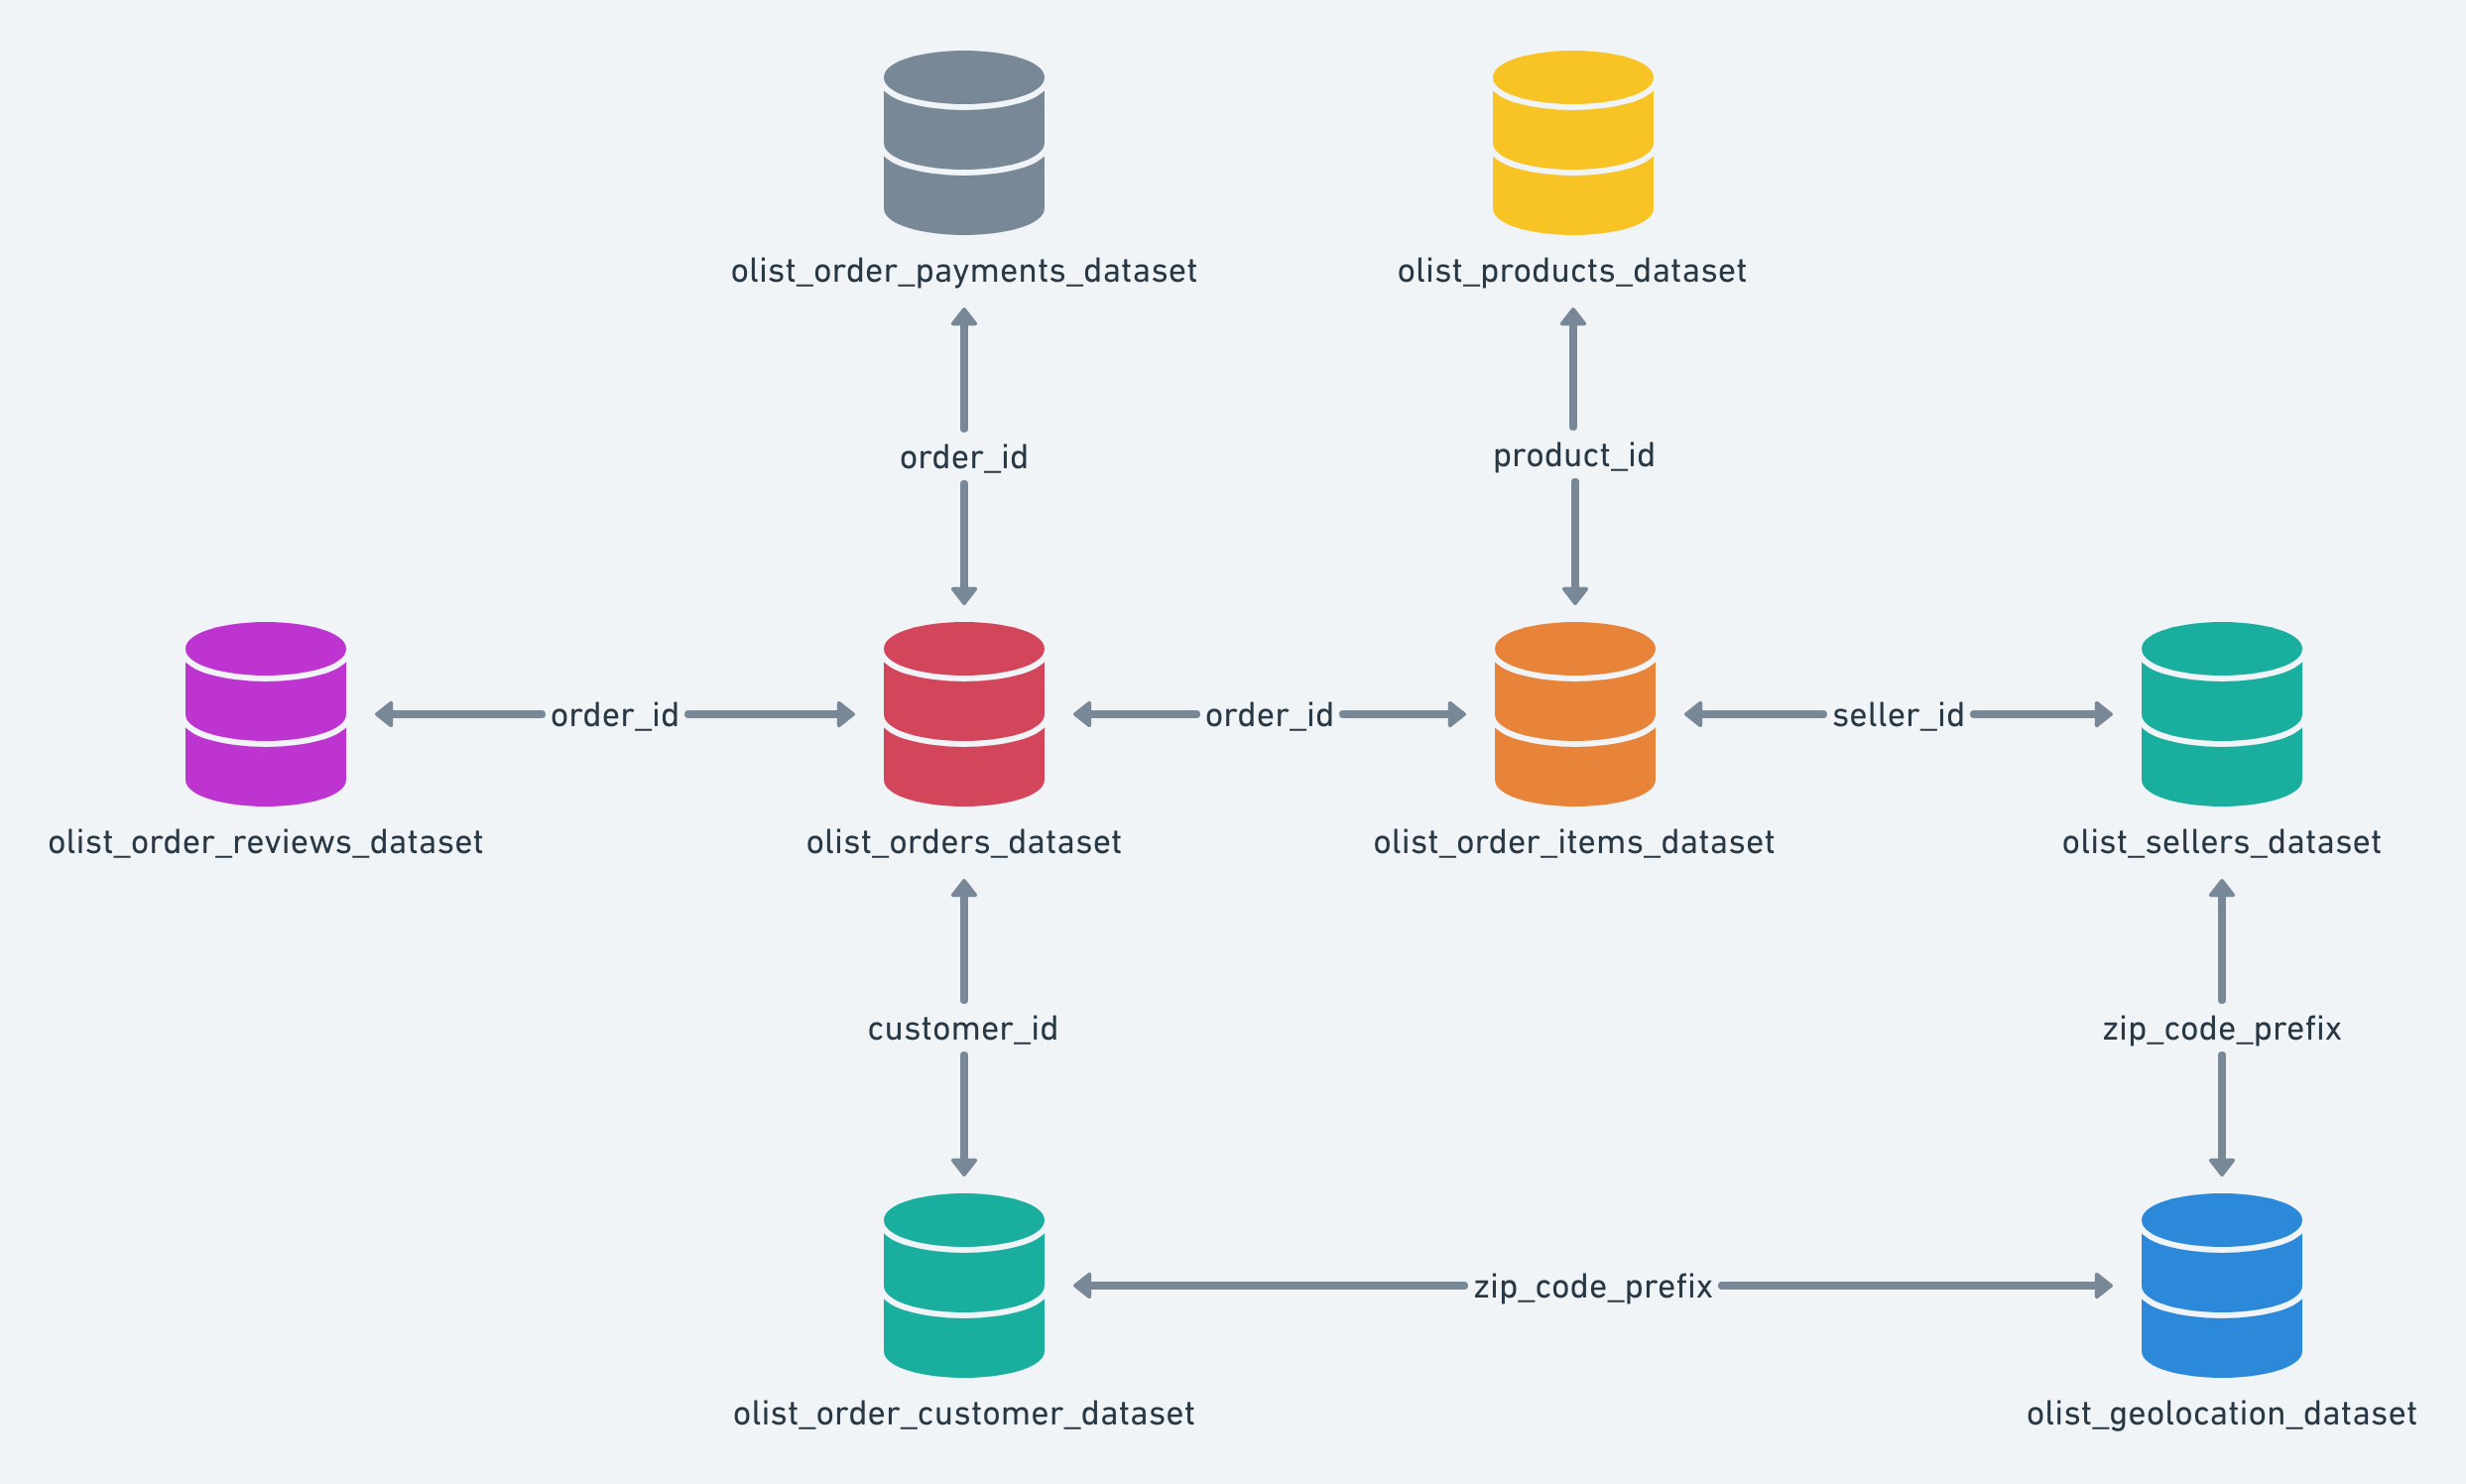
Data Architecture & Modeling
The Olist dataset represents a star schema with orders as the central fact table, connected to dimension tables for customers, sellers, products, and geolocation. The analysis required understanding complex relationships including:
- One-to-many relationships between orders and items (multi-seller orders)
- Multiple payment methods per order (split payments)
- Temporal analysis across order lifecycle (purchase → approval → delivery)
- Geospatial considerations for logistics optimization
Orders (Fact)
96K+ orders with status, timestamps, and delivery dates
Order Items
Product-seller pairs with price and freight values
Customers
Customer profiles with unique IDs and geolocation
Sellers
Seller information and geographic distribution
Payments
Payment methods, installments, and transaction values
Reviews
Customer ratings and feedback timestamps
Products
Product catalog with 74 categories and attributes
Geolocation
ZIP code coordinates for distance calculations
Analysis 1: Logistics Performance by State
Business Question
What is the average delivery time from purchase to delivery for each customer state? Which are the 5 slowest and 5 fastest states?
SQL Techniques Applied
- CTEs (Common Table Expressions): Modular query structure for calculating delivery days per order
- DATEDIFF(): Temporal analysis between purchase and delivery timestamps
- Window Functions: DENSE_RANK() OVER (ORDER BY) for bidirectional ranking
- Aggregations: AVG() and COUNT() grouped by state
- Data Quality Filters: Handling NULL timestamps and non-delivered orders
Query Architecture
-- Conceptual Structure (Simplified)
WITH delivery_per_order AS (
  -- Calculate days between purchase and delivery
  -- Join orders with customers to get state
  -- Filter only delivered orders with valid timestamps
),
avg_per_state AS (
  -- Aggregate average delivery days by state
  -- Count total orders per state
),
rankings AS (
  -- Apply DENSE_RANK for slowest (DESC)
  -- Apply DENSE_RANK for fastest (ASC)
)
SELECT * FROM rankings ORDER BY avg_delivery_days DESC;
Key Findings
Business Impact: Northern states (RR, AP, AM) show 3x longer delivery times but represent only 0.3% of volume. This creates a vicious cycle: poor logistics → low penetration → no investment. Prioritizing Northeastern hubs (BA, PE) with 5K+ orders and 18-19 day averages offers better ROI.
Analysis 2: Revenue & Average Ticket by Category
Business Question
What is the total revenue and average ticket per order for each product category? How do categories compare in a performance ranking?
SQL Techniques Applied
- Multi-table JOINs: order_items → products → category_translation (LEFT JOIN for missing translations)
- COALESCE(): Fallback logic for untranslated categories
- Distinct Aggregations: COUNT(DISTINCT order_id) to avoid double-counting multi-item orders
- Calculated Metrics: Ticket = SUM(price) / COUNT(DISTINCT orders)
- Dual Ranking: DENSE_RANK() by ticket AND by revenue for comparative analysis
Query Architecture
-- Conceptual Structure
WITH items_enriched AS (
  -- Join order_items with products and translations
  -- Use COALESCE for category name fallback
),
category_aggregation AS (
  -- SUM(price) as total_revenue
  -- COUNT(DISTINCT order_id) as distinct_orders
  -- Calculate average_ticket
),
rankings AS (
  -- DENSE_RANK() OVER (ORDER BY ticket DESC)
  -- DENSE_RANK() OVER (ORDER BY revenue DESC)
)
SELECT * FROM rankings ORDER BY revenue_rank, ticket_rank;
Key Findings
Business Impact: Classic volume vs. value trade-off. "Watches & Gifts" (R$214 ticket, 5.6K orders) is the sweet spot for expansion. High-ticket niches like "Musical Instruments" (R$305) and "Office Furniture" (R$215) are underexploited — SEO/paid media could unlock 20-30% growth.
Analysis 3: Payment Behavior Analysis
Business Question
Which payment methods are most used and what is the average order value for each? Is there a significant difference between cash and installment payments?
SQL Techniques Applied
- CASE WHEN Logic: Classify payments as "cash" (installments ≤ 1) vs. "installment"
- ROW_NUMBER() Window: Identify dominant payment method per order (highest value)
- SUM() OVER (PARTITION BY): Calculate total order value across split payments
- PERCENT_RANK(): Percentile positioning of payment methods by average value
- Multi-CTE Pipeline: payments → per_order_fix → dominant_payment → aggregation
Query Architecture
-- Conceptual Structure
WITH payments_classified AS (
  -- CASE WHEN installments <= 1 THEN 'cash' ELSE 'installment'
),
order_dominant_method AS (
  -- ROW_NUMBER() OVER (PARTITION BY order_id ORDER BY value DESC)
  -- SUM(value) OVER (PARTITION BY order_id) as total_order_value
),
final_aggregation AS (
  -- AVG(total_order_value) by payment_type and modality
  -- COUNT(*) as order_count
)
SELECT *, PERCENT_RANK() OVER (ORDER BY avg_value) FROM final_aggregation;
Key Findings
Business Impact: Installment payments remove friction for high-value purchases, nearly doubling average order value. Highlighting "12x interest-free" on product listings could boost conversion by 15-25%. Boleto (20% of orders, R$145 avg) suggests unbanked customers with purchasing power — PIX integration could capture this segment with lower friction.
Analysis 4: Reviews vs. Delivery Delays
Business Question
Is there a correlation between delivery delays and review scores? What is the average delay for each rating tier (1-5 stars)?
SQL Techniques Applied
- GREATEST() Function: Calculate delay as MAX(0, actual - estimated) to avoid negative values
- DATEDIFF() on Dates: Temporal delta between delivery and estimated dates
- NTILE(5) Window: Divide delay distribution into quintiles for performance segmentation
- JOIN with Filtering: Inner join reviews with orders (only delivered, non-null dates)
- Aggregation by Score: AVG(delay) and COUNT(*) grouped by review_score
Query Architecture
-- Conceptual Structure
WITH delay_calculation AS (
  -- GREATEST(DATEDIFF(delivered, estimated), 0) as delay_days
  -- Filter: status = 'delivered' AND dates NOT NULL
),
reviews_with_delay AS (
  -- JOIN reviews with delay_calculation on order_id
  -- Filter: review_score BETWEEN 1 AND 5
),
aggregated AS (
  -- AVG(delay_days) by review_score
  -- COUNT(*) as review_count
),
quintiles AS (
  -- NTILE(5) OVER (ORDER BY avg_delay ASC) as performance_quintile
)
SELECT * FROM quintiles ORDER BY review_score;
Key Findings
Business Impact: Strong negative correlation: each delay day exponentially increases dissatisfaction. 59% of reviews are 5-star with near-zero delay, proving logistics excellence drives NPS. Proactive alerts ("Your order may be 1 day late, here's 10% off next purchase") could recover 20-30% of at-risk ratings and reduce churn.
Analysis 5: Customer Loyalty & Recurrence
Business Question
How many orders does each customer place on average? Who are the most recurrent customers and what is the average interval between their orders?
SQL Techniques Applied
- LAG() Window Function: Access previous order timestamp within customer partition
- PARTITION BY customer_unique_id: Calculate intervals per customer independently
- DATEDIFF() on LAG: Days between consecutive orders
- Nested Aggregations: AVG(interval) per customer, then AVG(orders) across customers
- LEFT JOIN for Intervals: Include customers with only 1 order (no interval)
Query Architecture
-- Conceptual Structure
WITH customer_orders AS (
  -- LAG(purchase_timestamp) OVER (PARTITION BY customer_unique_id ORDER BY timestamp)
  -- Join orders with customers to get unique_id
),
intervals AS (
  -- DATEDIFF(current_order, previous_order) as days_between
  -- Filter: WHERE previous_order IS NOT NULL
),
customer_aggregation AS (
  -- COUNT(*) as total_orders per customer
  -- AVG(days_between) as avg_interval per customer
)
SELECT * FROM customer_aggregation ORDER BY total_orders DESC LIMIT 50;
Key Findings
Business Impact: Critical retention problem: 97% of customers are one-time buyers (avg 1.03 orders). Top customer with 272 orders (every 29 days) suggests B2B/reseller behavior — opportunity for corporate program. Implementing progressive cashback (1% → 3% → 5% at milestones) and reactivation campaigns (60-day inactivity trigger) could increase LTV by 25-40%.
Technical Skills
Advanced SQL
- CTEs (Common Table Expressions)
- Window Functions (RANK, LAG, NTILE)
- Complex JOINs (multi-table)
- Subqueries & Nested Aggregations
Business Intelligence
- KPI Definition & Tracking
- Cohort & Funnel Analysis
- Customer Segmentation
- Predictive Insights
Data Modeling
- Star Schema Design
- Fact & Dimension Tables
- Relationship Mapping
- Data Quality Validation
Strategic Thinking
- Hypothesis-Driven Analysis
- Actionable Recommendations
- ROI Prioritization
- Stakeholder Communication
Strategic Conclusions & Roadmap
This analysis transformed raw transactional data into a strategic roadmap with 3 high-impact initiatives projected to increase revenue by 12-18% and NPS by 15-20 points within 6 months.
Priority Actions (90-Day Roadmap)
🔴 HIGH PRIORITY
- Highlight Installment Payments: Show "12x interest-free" on product listings → +15-20% conversion
- Proactive Delay Alerts: Notify customers before delays with compensation → -30-40% negative reviews
- Regional Delivery Expectations: Adjust checkout estimates by state → -20% complaints
🟡 MEDIUM PRIORITY
- Loyalty Program: Progressive cashback (1% → 5%) → +10-15% repeat purchase rate
- Category Bundles: Cross-sell high-volume + high-ticket categories → +8-12% AOV
- Data Hygiene: Mandatory category validation for sellers → +5-10% recommendation accuracy
🟢 LONG-TERM
- Regional Hubs: Forward stocking in Northeastern capitals → -20-30% delivery time
- Subscription Model: Recurring orders for replenishment categories → New revenue stream
- B2B Program: Identify high-frequency customers (20+ orders) → Corporate pricing & support
Projected Impact (Conservative Estimates)
Methodology & Tools
Analysis Pipeline
- Data Exploration: Profiled 9 tables, validated relationships, identified data quality issues
- Hypothesis Formation: Defined 5 business questions aligned with e-commerce KPIs
- SQL Development: Built modular CTEs with window functions in MySQL 8.0
- Validation: Cross-checked aggregations, tested edge cases (NULLs, outliers)
- Insight Extraction: Translated statistical findings into actionable recommendations
- Prioritization: Ranked initiatives by impact/effort using ROI framework
Technology Stack
- Database: MySQL 8.0+ (CTEs, window functions, JSON support)
- Query Tool: MySQL Workbench / DBeaver
- Data Processing: Python (pandas, SQLAlchemy) for automation
- Version Control: Git for SQL script management
- Documentation: Markdown for query documentation and business logic